此網站是否即時更新?數據多久刷新一次?

網站數據會定期更新。基礎光害數據來自 NOAA 的 VIIRS 數據,通常每年更新以確保全面覆蓋和準確性。我們計劃在未來整合更多數據來源。

地圖上的「波特爾等級」是什麼意思?如何解讀?
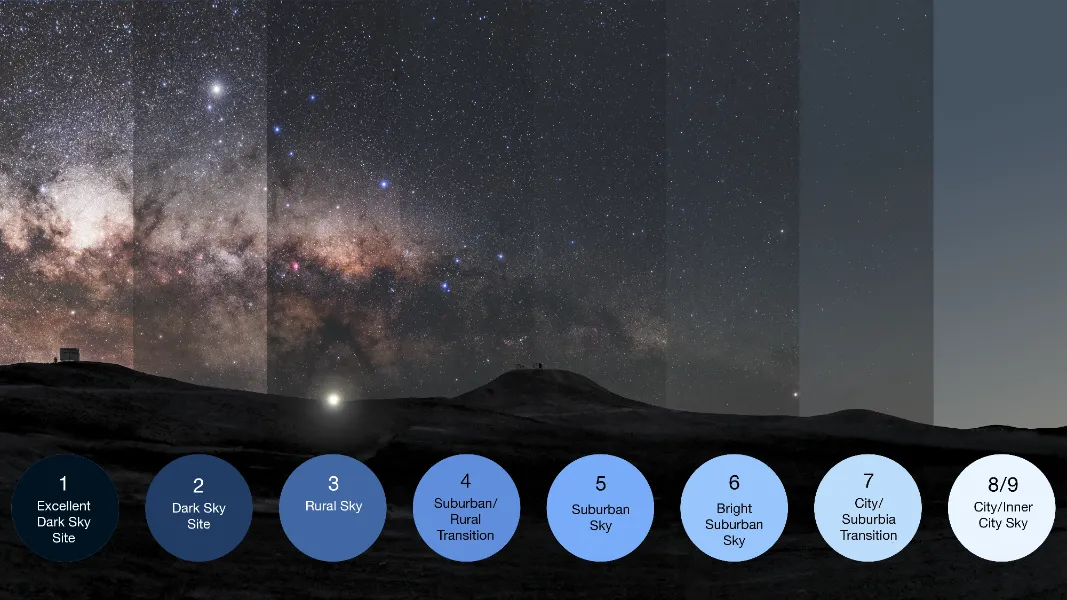
Bortle scale representation showing different levels of light pollution from Class 1 (darkest) to Class 9 (brightest)
© ESO/P. Horálek, M. Wallner - Representation of the Bortle scale
The Bortle Scale is a standard way to measure how dark the night sky is. It's useful for stargazing, ranging from Class 1 (pitch black) to Class 9 (heavily light-polluted). Lower numbers mean more stars visible. Our map uses color codes to help you quickly see how dark the sky is at any location.

什麼是「SQM」,它與波特爾等級有何不同?

SQM (Sky Quality Meter) shows night sky brightness in precise numbers, measured in magnitudes per arcsecond squared (mag/arcsec²). Higher values mean darker skies. While the Bortle Scale is more of a category system, SQM gives exact values, and can be converted to Bortle classes for easier understanding.

如何找到我附近最佳的觀星地點?

United States light pollution map with dark sky places and stargazing locations marked in different colors
US light pollution map with dark sky places and stargazing locations

我們的系統根據您的 IP 地址分析您的大概位置,並自動顯示該區域的波特爾等級。您也可以搜尋特定地址或手動探索地圖,發現其他地區的最佳觀星點。

地圖能顯示極光活動嗎?有推薦的極光觀測區域嗎?

Aurora probability map screenshot showing northern lights forecast with color-coded intensity levels across northern regions
Aurora probability map showing real-time northern lights forecast

我們正在整合即時極光預測工具(如 KP 指數)和觀測圖層到我們的地圖中。這將幫助北歐、加拿大和阿拉斯加等高緯度地區的用戶追蹤和追尋極光觀測。

我可以用這個來規劃銀河攝影嗎?

當然可以!地圖結合光害水平和地理數據,幫助您找到銀河觀測和攝影的理想地點。我們也計劃添加銀河升起時間和方向等功能,支援天文攝影師有效規劃拍攝。

此地圖針對行動裝置優化了嗎?有應用程式版本嗎?

This website is fully optimized for mobile devices, so it works smoothly anywhere. You can also check sky conditions and light pollution using the StargazingHub App.

支援哪些國家或地區?這是全球地圖嗎?

Global light pollution map worldwide showing light pollution levels across different continents and countries with color-coded intensity
Global light pollution map showing worldwide distribution of artificial light at night
Yes, lightpollutionmap.app shows light pollution worldwide, covering most countries and regions. It's great for stargazers and travelers. We also offer a Chinese version at Darkmap.cn.

光害數據的來源是什麼?可靠嗎?

Our data mainly comes from NOAA's VIIRS, with the map created by David Lorenz. We'll soon add data from the World Atlas 2015, based on research by Falchi et al.

如何分享地圖上的特定位置?

You can go directly to a specific spot by adding coordinates to the URL: https://lightpollutionmap.app/?lat=25.3125&lng=-80.6875&zoom=8. Use this to share locations or bookmark your favorite stargazing places. Just change the latitude (lat), longitude (lng), and zoom level.

有用戶社群或上傳觀測報告的功能嗎?

我們計劃建立觀星愛好者社群,用戶可以上傳實地觀測報告、照片和建議。這將豐富我們的地圖數據,讓用戶分享觀測經驗。

使用此服務需要付費嗎?有哪些付費功能?

我們網站的基本功能永久免費使用。目前我們沒有會員制計劃,您可以放心使用我們的光害地圖。

初學者如何開始夜空觀測?地圖如何幫助?

地圖幫助觀星者快速找到附近合適的觀測地點,並提供波特爾等級資訊和基本天文指導。我們計劃在未來擴展初學者教程和觀測建議,幫助您輕鬆開始觀星之旅。

如何減少光害對天文觀測的影響?

To minimize the effects of light pollution on your astronomical observations, we recommend using Light Pollution Filters. These specialized filters can significantly improve visibility by blocking specific wavelengths of artificial light while allowing starlight to pass through. For quality options, check out Optolong Light Pollution Filters, which offer solutions for both visual observation and astrophotography.

最後更新: