What does "Bortle Scale" on the map mean? How should I interpret it?
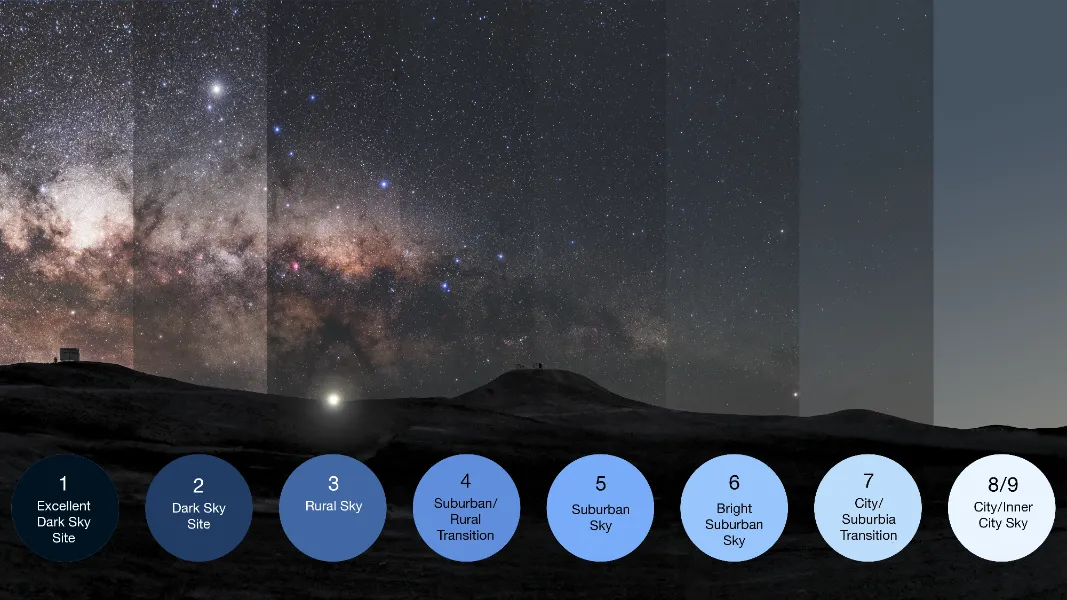
Bortle scale representation showing different levels of light pollution from Class 1 (darkest) to Class 9 (brightest)
© ESO/P. Horálek, M. Wallner - Representation of the Bortle scale
On this site, the Bortle Scale is a public-friendly reference, not the underlying physical quantity. It is useful for a quick read, but if you want a more rigorous comparison between observing sites, pay more attention to SQM and the all-sky skyglow simulation.

Is this website updated in real-time? How often is the data refreshed?

The latest completed annual satellite layer is 2025. The 2026 values are estimates and are revised as additional monthly inputs become available. The site is not a real-time light-pollution measurement service. For observing-site comparisons, read SQM together with the all-sky skyglow simulation rather than relying on a Bortle label alone.

What is "SQM" and how does it differ from the Bortle Scale?

SQM measures sky brightness in mag/arcsec² and is more useful than a single Bortle class when you want to compare observing conditions. We recommend reading SQM together with the all-sky skyglow simulation, because directional brightness matters and one class cannot describe the whole sky.

How can I find the best stargazing locations near me?

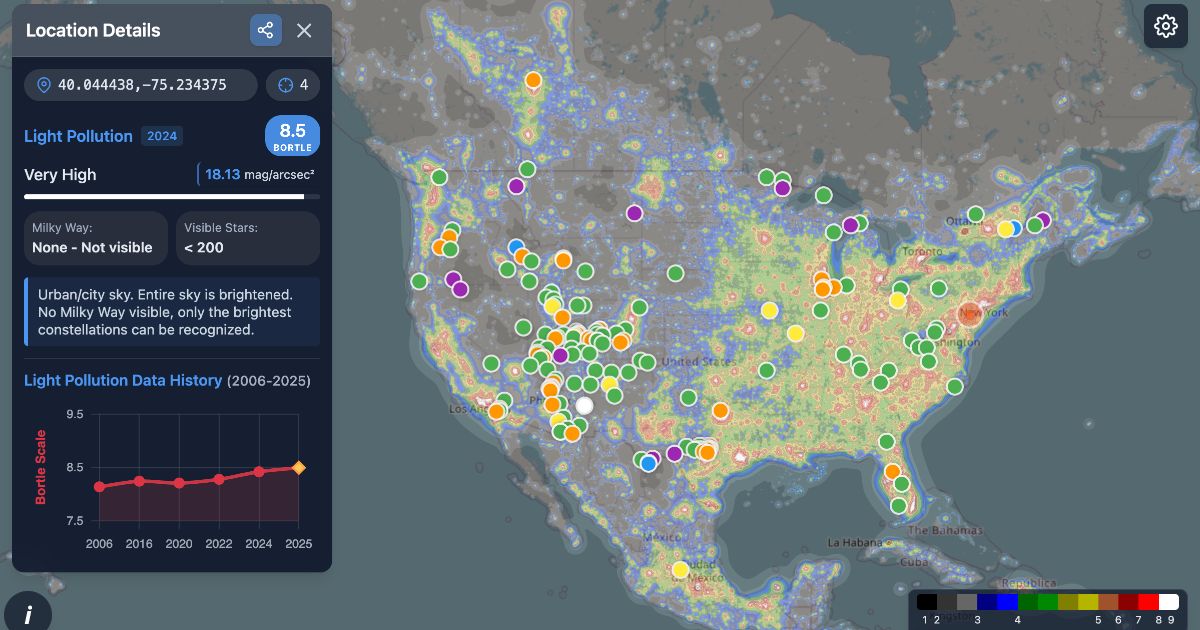
United States light pollution map with dark sky places and stargazing locations marked in different colors
US light pollution map with dark sky places and stargazing locations

Our system analyzes your approximate location based on your IP address and automatically displays the Bortle class for that area. You can also search for specific addresses or manually explore the map to discover optimal stargazing spots in other regions.

Can the map show aurora activity? Are there recommended regions for aurora viewing?

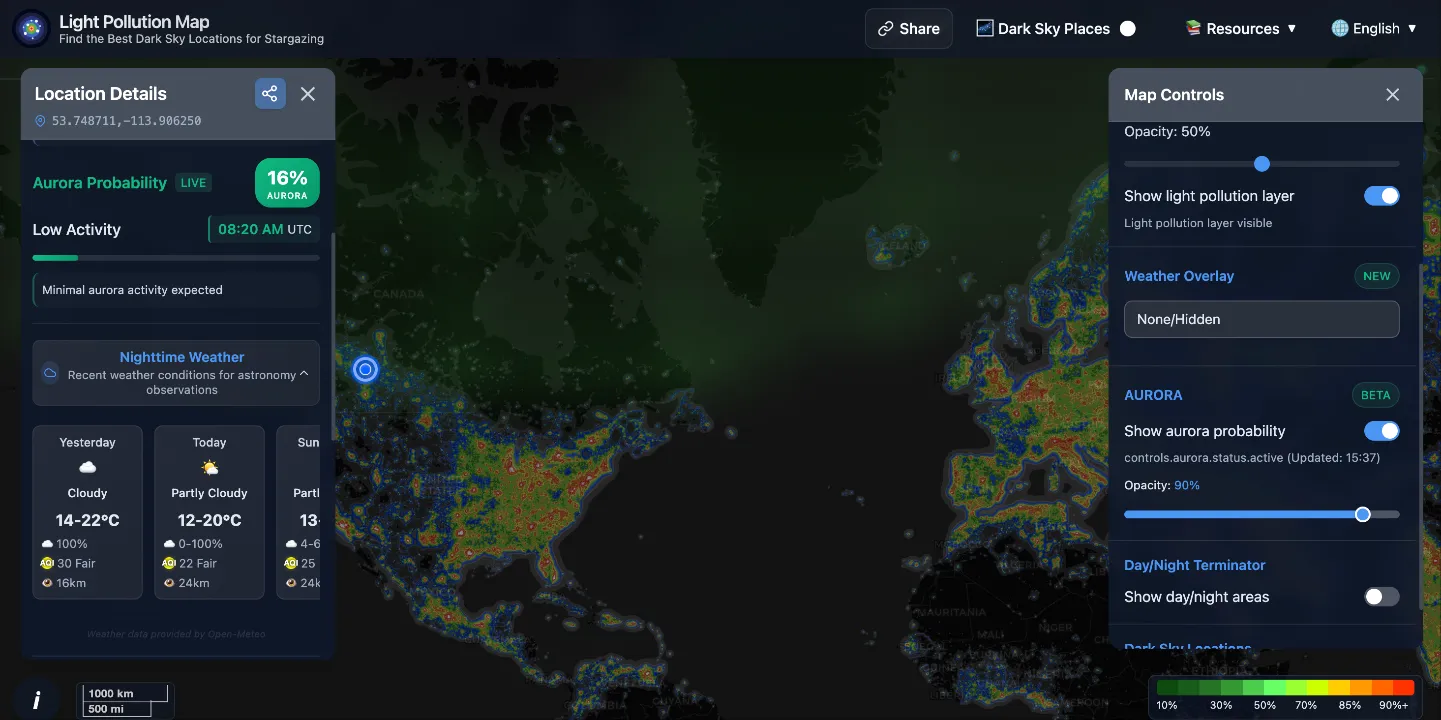
Aurora probability map screenshot showing northern lights forecast with color-coded intensity levels across northern regions
Aurora probability map showing real-time northern lights forecast

Yes. Turn on the Aurora Probability layer to view the current NOAA-based aurora forecast. Treat it as a planning signal: local cloud, darkness, latitude, and forecast uncertainty still determine whether an aurora will be visible.

Can I use this to plan Milky Way photography sessions?

Yes. Use the light-pollution layer to shortlist darker locations, then open the all-sky skyglow view to compare directional brightness and the Milky Way at the selected sky time. Confirm moonlight, weather, access, and target timing before a shoot.

Is this map optimized for mobile use? Is there an app version?

This website is fully optimized for mobile devices, so it works smoothly anywhere. You can also check sky conditions and light pollution using the Free Stargazing APP.

Which countries or regions are supported? Is it a global map?

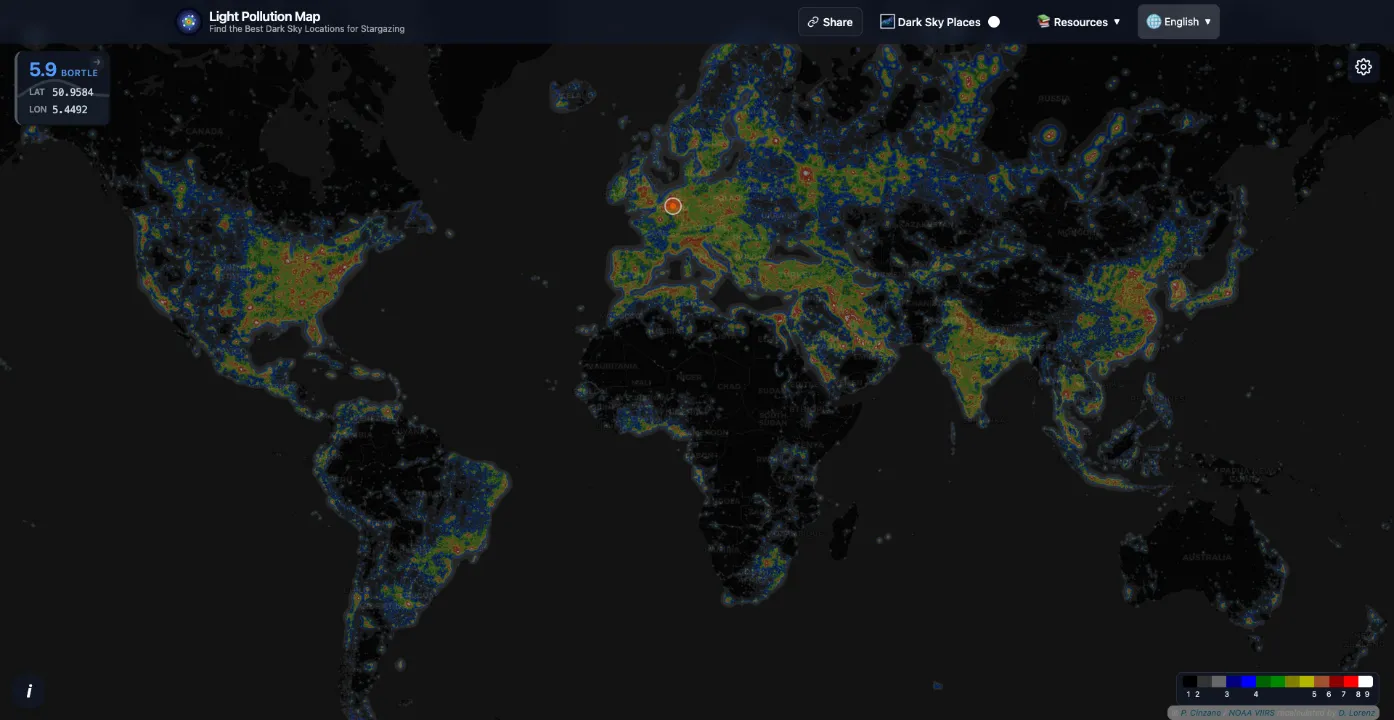
Global light pollution map worldwide showing light pollution levels across different continents and countries with color-coded intensity
Global light pollution map showing worldwide distribution of artificial light at night
Yes, lightpollutionmap.app shows light pollution worldwide, covering most countries and regions. It's great for stargazers and travelers. We also offer a Chinese version at Darkmap.cn.

What's the source of the light pollution data? Is it reliable?

The 2025 annual layer is generated by LightPollutionMap.app from NOAA VIIRS annual night-light data using our sky-brightness modelling pipeline. Values labelled 2026 are model estimates, not a completed annual satellite layer, and are revised as monthly inputs are added. For presentation, we reference the light-pollution and SQM color correspondence used in part of David Lorenz's work.

How can I share a specific location on the map?

You can go directly to a specific spot by adding coordinates to the URL: https://lightpollutionmap.app/?lat=25.3125&lng=-80.6875&zoom=8. Use this to share locations or bookmark your favorite stargazing places. Just change the latitude (lat), longitude (lng), and zoom level.

Is there a user community or feature for uploading observation reports?

We're planning to build a community for stargazing enthusiasts where users can upload field observation reports, photos, and suggestions. This will enrich our map data and allow users to share their observation experiences.

Is there a fee for using this service? What premium features are available?

Our website's basic features are permanently free to use. Currently, we don't have plans for a membership program, so you can use our light pollution map with confidence.

How can beginners get started with night sky observation? How does the map help?

The map helps stargazers quickly find suitable observation locations nearby and provides Bortle class information along with basic astronomical guidance. We plan to expand beginner tutorials and observation recommendations in the future to help you easily start your stargazing journey.

How can I reduce the impact of light pollution on astronomical observations?

To minimize the effects of light pollution on your astronomical observations, we recommend using Light Pollution Filters. These specialized filters can significantly improve visibility by blocking specific wavelengths of artificial light while allowing starlight to pass through. For quality options, check out Optolong Light Pollution Filters, which offer solutions for both visual observation and astrophotography.

Last Updated: