
Built from historical data
The layer is produced from multiple years of historical data. It is designed to reveal persistent seasonal patterns that are difficult to see from a single forecast or one unusually good year.
 Stargazing Hub App
The clear-sky layer adds a long-term climate signal to the light pollution map. Use it to compare destinations and seasons, then check a short-range forecast before you travel.
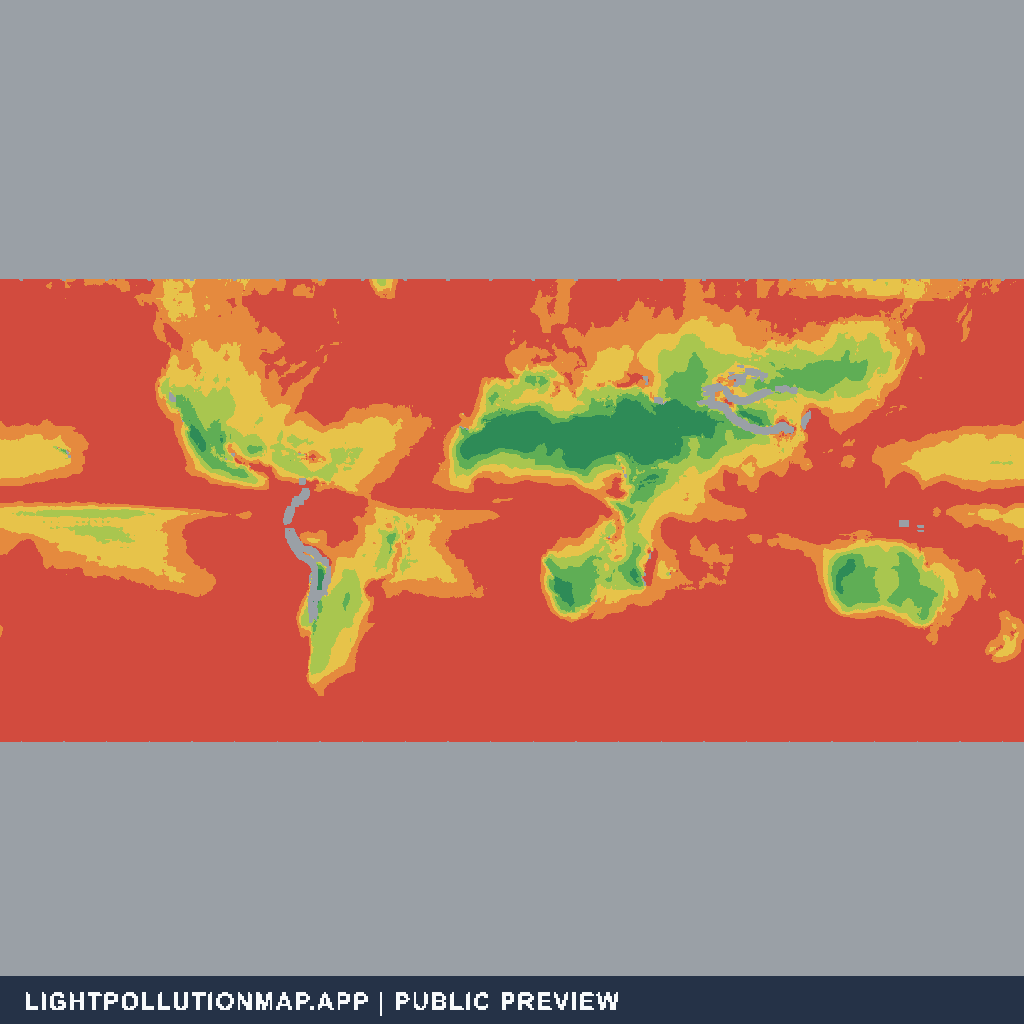
This is a screening tool for climate patterns, not a promise about a particular night. The public layer is intentionally expressed as broad bands so the signal is useful without implying more precision than the data supports.
The layer is produced from multiple years of historical data. It is designed to reveal persistent seasonal patterns that are difficult to see from a single forecast or one unusually good year.
We disclose the purpose, interpretation, confidence treatment, and known limits. Source weighting, quality thresholds, cleaning rules, gap handling, grid resolution, and production code remain proprietary.
Gray areas mean the available evidence is less consistent or less complete. Gray does not mean the location never has clear nights, and it should not be compared numerically with the colored bands.
Mountains, valleys, coastal fog, smoke, dust, terrain shadows, and fast weather changes can produce conditions that a broad climate layer cannot resolve. Always verify the actual site and date.
A reliable observing plan combines broad screening with increasingly current information.
Start with the annual layer to rule in destinations that are both dark and broadly favorable for clear nights. Do not judge a site from clear-sky climate alone.
Switch from Year to individual months. Look for a season that improves the climate signal while still offering enough nighttime darkness for your target.
Once the trip window is close, check cloud, humidity, wind, smoke, moonlight, access, and safety. The climate layer cannot replace a forecast.
Treat them as layers in one decision, not competing predictions.
| Tool | Question it answers | Useful horizon | Main limitation |
|---|---|---|---|
| Clear-sky climate | Which regions and months have historically offered better clear-night odds? | Early destination and season research | Cannot predict a specific night |
| Short-range forecast | What are cloud, humidity, wind, and visibility likely to be for this date? | The final days before observing | Becomes less certain farther from the date |
| On-site check | What is happening at the exact observing location now? | The same evening | Too late for choosing a distant destination |
The two views support different decisions. Switching between them is more informative than searching for one global best month.
Use the Year setting to compare broad destination quality without overreacting to one season. It is the fastest way to find areas worth deeper research.
Use a month when dates are constrained or when seasonal weather dominates. Compare nearby months too, because climate boundaries do not follow calendar pages exactly.
No. It summarizes multi-year historical climate patterns in broad ranges. Use a current forecast for a particular night.
Gray marks lower-confidence coverage. It is an uncertainty signal, not a claim that the place is always cloudy.
The map is broad and historical. Location-specific tools can use a more precise point and newer conditions, so differences are expected.
Yes. Open the map, enable the clear-sky layer, and choose Year or any month from the legend panel.